
Charles Darwin’s first trip to the Galapagos Islands caused ecologists to start wondering why some places have so many species and others have so few. ©Longjourneys/Shutterstock.com
Ever since the HMS Beagle arrived in the Galapagos Islands with a young Charles Darwin aboard—who was soon to meet a fateful family of finches—ecologists have struggled to understand a particularly perplexing question: Why is there such a ridiculous abundance of species in some places on Earth and a scarcity in others? In other words, what are the exact factors that drive animal diversity?
Scientists think that they have now found an answer to that fundamental ecological question. They’ve discovered that what an animal eats—and how that interacts with the climate—shapes the planet’s biodiversity.
And when it comes to biodiversity, we’re now losing it so rapidly that we’re no longer able to ask what’s going on with every species individually. So, researchers have developed a framework that can help scientists understand trends in biodiversity by using data from well-characterized species to provide insights on data-deficient species. It’s called the “Robin Hood approach.”

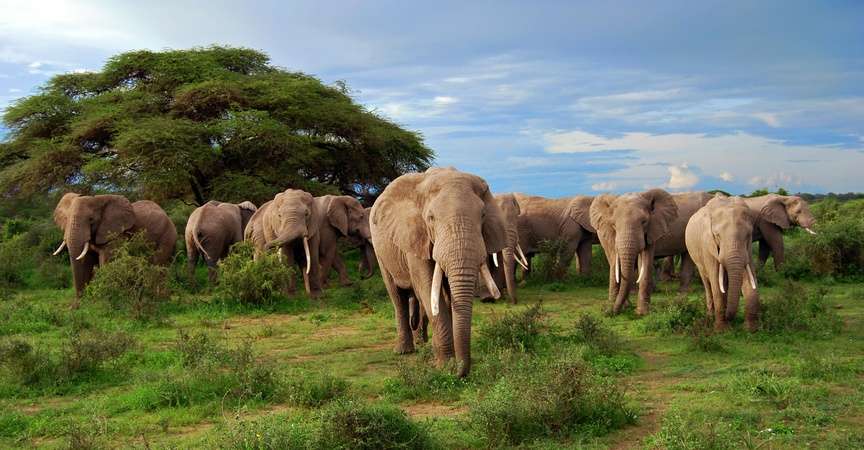
Africa has an abundance of meat-eating predators. Rain patterns and plant growth are responsible. ©Mogens Trolle/Shutterstock.com
Rain drives animal diversity
Have you ever noticed that certain locations—such as Africa or places in the far North like Greenland—have a plentitude of meat-eating predators? And that herbivores are more common in cooler areas, and omnivores tend to be more dominant in warm places?
It turns out that two key factors were crucial in shaping these patterns: precipitation and plant growth.
This conclusion comes from a Department of Watershed Sciences research team at Utah State University’s Quinney College of Natural Resources that had access to a mammoth set of global-scale climate data and a novel strategy.

Madagascar, where precipitation patterns have an equal, six-month split between a wet season and a dry season, had the ideal ecological mix for herbivores, such as lemurs. ©OHudecek/Shutterstock.com
Historically, say the researchers, studies looking at the distribution of species across the Earth’s latitudes have overlooked the role of trophic ecology, which means how what animals eat impacts where they are found. This new work, published in the science journal Ecology Letters in September 2023, shows that herbivores, omnivores and predators are not randomly scattered across the globe. There are patterns to where these groups of animals are found. And precipitation across time plays a huge role in determining where different groups of mammals thrive. Geographical areas where precipitation varies by season, without being too extreme, had the highest levels of mammal diversity.
However, the total amount of rain was not the determining factor. If you imagine ecosystems around the world on a scale of precipitation and season, certain places in Utah and the Amazon rain forest fall on one end with low variability; they have steady levels of precipitation throughout the year. Other regions, such as southern California, have high variability, getting about 75% of their annual precipitation between December and March. But the sweet spot for herbivores and predators fell in a middle zone between the two extremes.
For example, places such as Madagascar, where precipitation patterns had an equal split between a wet season and a dry season (six months each), had the ideal ecological cocktail for promoting conditions for herbivores and predators. Omnivore diversity tends to thrive in places with very stable climates.

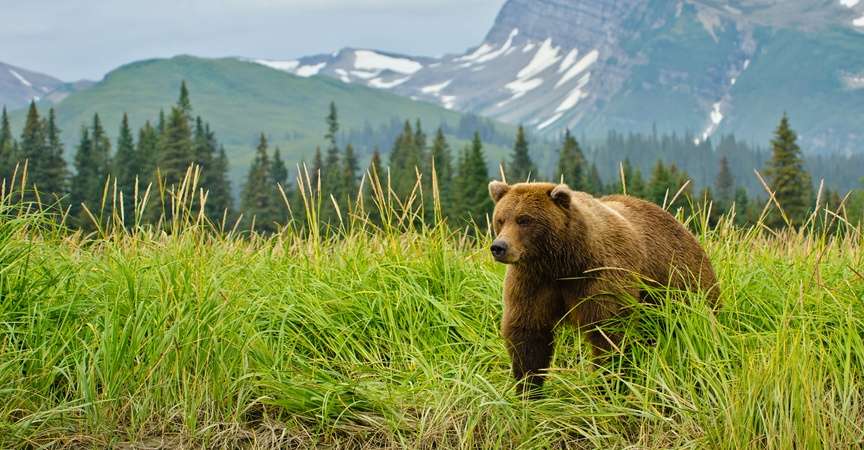
It was surprising to find that plant growth was more important for predators than herbivores and omnivores. Why remains a mystery. ©Ondrej Prosicky/Shutterstock.com
The second important factor that was discovered to relate to mammal diversity was the amount of plant growth in an area, measured as “gross primary productivity.” While it makes intuitive sense for plant-eating animals (herbivores and omnivores) to benefit from plant growth, surprisingly this measure impacted carnivores the most, according to the research. Why remains a mystery. But the strong relationship between predators and plant growth highlights the importance of an abundance of plants on an entire food chain’s structural integrity.
Although evolutionary processes are ultimately responsible for spurring differences in species, climate conditions can affect related factors—such as animal dispersal, extinctions and rates of evolutionary change—influencing species and trait-based richness. Identifying the ecological mechanisms that help drive richness patterns, as this research has done, provides insight for better managing and predicting how diversity could change under future climate changes.
Robin Hood inspires biodiversity tracking
As the above research demonstrates, animal diversity can act as an alarm system for the stability of ecosystems. And now, to better understand and protect the world’s biodiversity, a research team at Michigan State University has developed a “Robin Hood” approach.

The IUCN lists orcas (killer whales) as “data deficient.” That means that they lack the data needed to inform their conservation status. ©Jeroen Mikkers/Shutterstock.com
That is to say that they’re using information from well-quantified animals to reveal insights about less common, harder-to-observe species. So, they’re taking insights from the data-rich and giving to the data-poor.
Currently, about one in seven species are classified as “data deficient” by the International Union for Conservation of Nature (IUCN). That means that these species lack the data needed to establish their conservation status, which, in turn, helps determine conservation strategies. We need more rapid and efficient assessments of those species if we want to figure out how to conserve and protect them.
To that end, the Michigan State University team has introduced a framework based on what are known as “integrated community models.” In their paper, published in the Journal of Animal Ecology in October 2023, the researchers show how they design and implement these models to utilize data from the best-characterized species in a community to assess other members of the group.

Unfortunately, the most popular animals to study aren’t necessarily the ones most in need of attention. After analyzing almost 16,500 papers published between 1900 and 2010, the big winner was bears (family “Ursidae”), averaging more than 250 papers per species. The closest runner-up was the walrus family (“Odobenidae”), with only 145 papers. By borrowing strength from the species that have the most information available, scientists can get species-level estimates for all members of a community. ©Ludmila Ruzickova/Shutterstock.com
By borrowing strength from the species that have the most information or are most common, scientists can get species-level estimates for all members of a community and a comprehensive understanding of what’s going on with the community as a whole.
This new report acts as a how-to guide for anyone who wants to draw insights from a variety of different data sources describing multiple species. In this guide, the scientists provided three case studies: forest birds in the northeastern United States, butterflies in the Midwest and a simulation scenario for 10 hypothetical species. The results show how integrated community models can be used to estimate species’ trends and demographic rates over space and time, even for rarer species.
The immediate goal for the report was to get these methods into the hands of more researchers. The next step will be working with partners in government and nongovernmental organizations who can use information from the models to develop conservation strategies that move from a species-by-species approach to one that’s more holistic.

According to World Wildlife Fund’s “Living Planet Report 2022,” freshwater animals, such as this Amazon pink river dolphin, have been hit the hardest: they have declined by an average of 83% since 1970. Habitat loss and barriers to migration routes account for about half of the threats to these populations. ©COULANGES/Shutterstock.com
The Living Planet Report provides context—and caution
World Wildlife Fund’s Living Planet Report 2022 held some alarming news: the world has seen an average 69% drop in amphibian, bird, fish, mammal and reptile populations since 1970. The dual crises of biodiversity loss and climate change are driven by the unsustainable use of our planet’s resources. Scientists are clear: unless we stop treating these emergencies as two separate issues, neither problem will be addressed effectively.
Both crises have negative consequences for all the world’s ecosystems. Forecasting how climate change will disrupt animal systems going forward is extremely important. The Utah State University research and the new “Robin Hood” framework could be the first steps in our better managing future conditions for wildlife—and, thus, for ourselves—around the globe.
Here’s to finding your true places and natural habitats,
Candy


